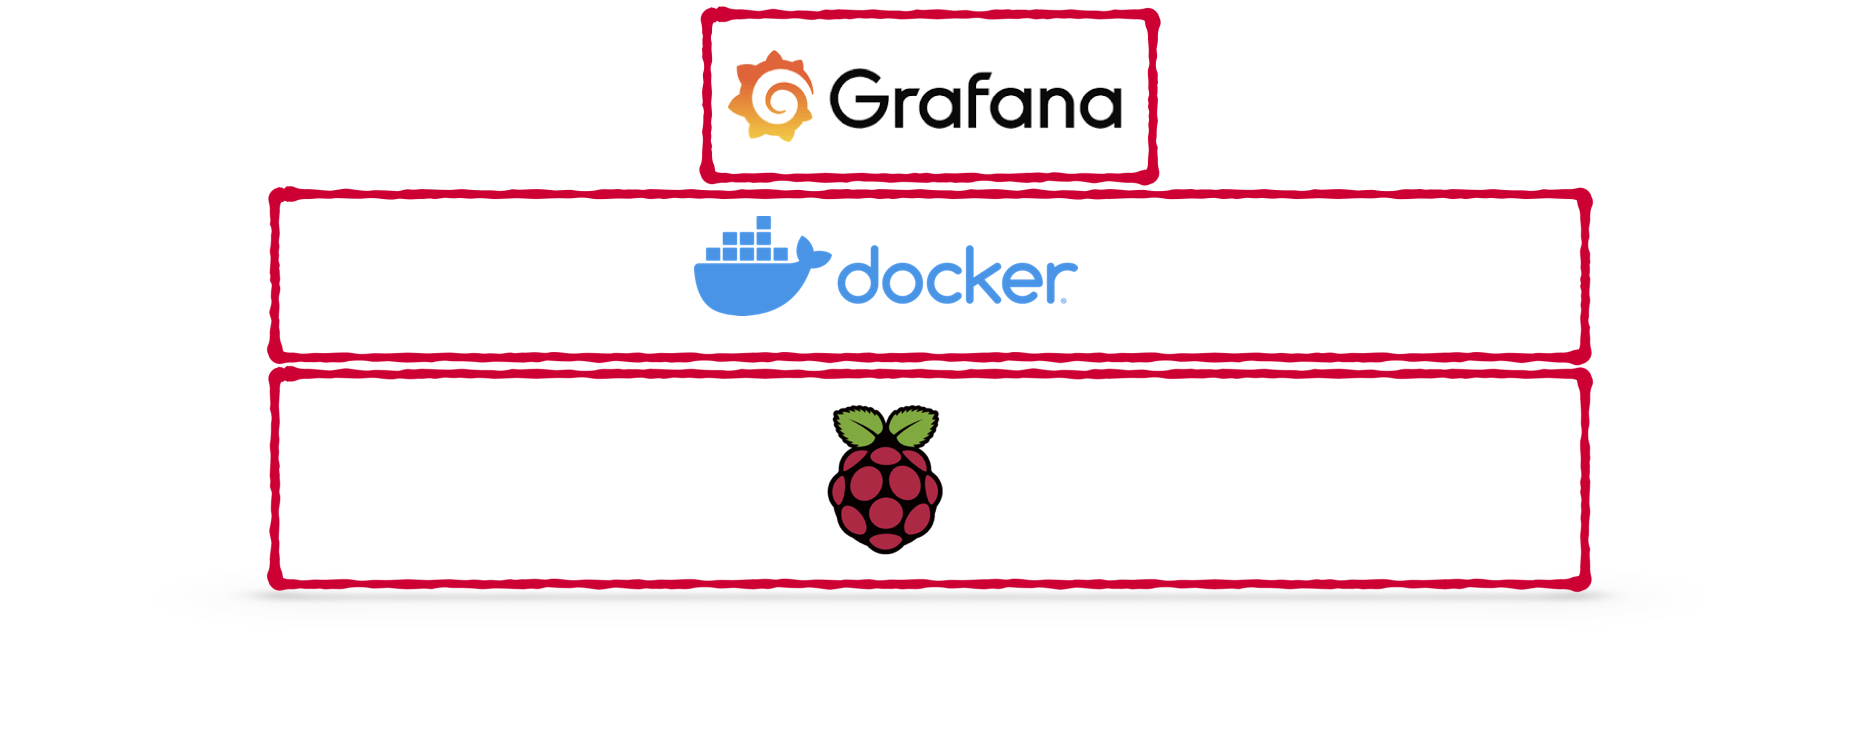
Setting up Grafana on Raspberry Pi with Docker (compose)
In previous blog posts I showed you how to setup a Raspberry Pi with docker-compose support and how to run InfluxDB on your Raspberry Pi. This tutorial will add Grafana to your Pi-stack and give you a complete monitoring setup. The InfluxDB+Grafana stack is heavily used in DevOps scenarios but also extremely useful if you want to visualize any kind of timeseries data at home; power consumption, smart home events, computer uptime, amount of devices in your network, weather in your basement … endless opportunities at your fingertips!
Continue reading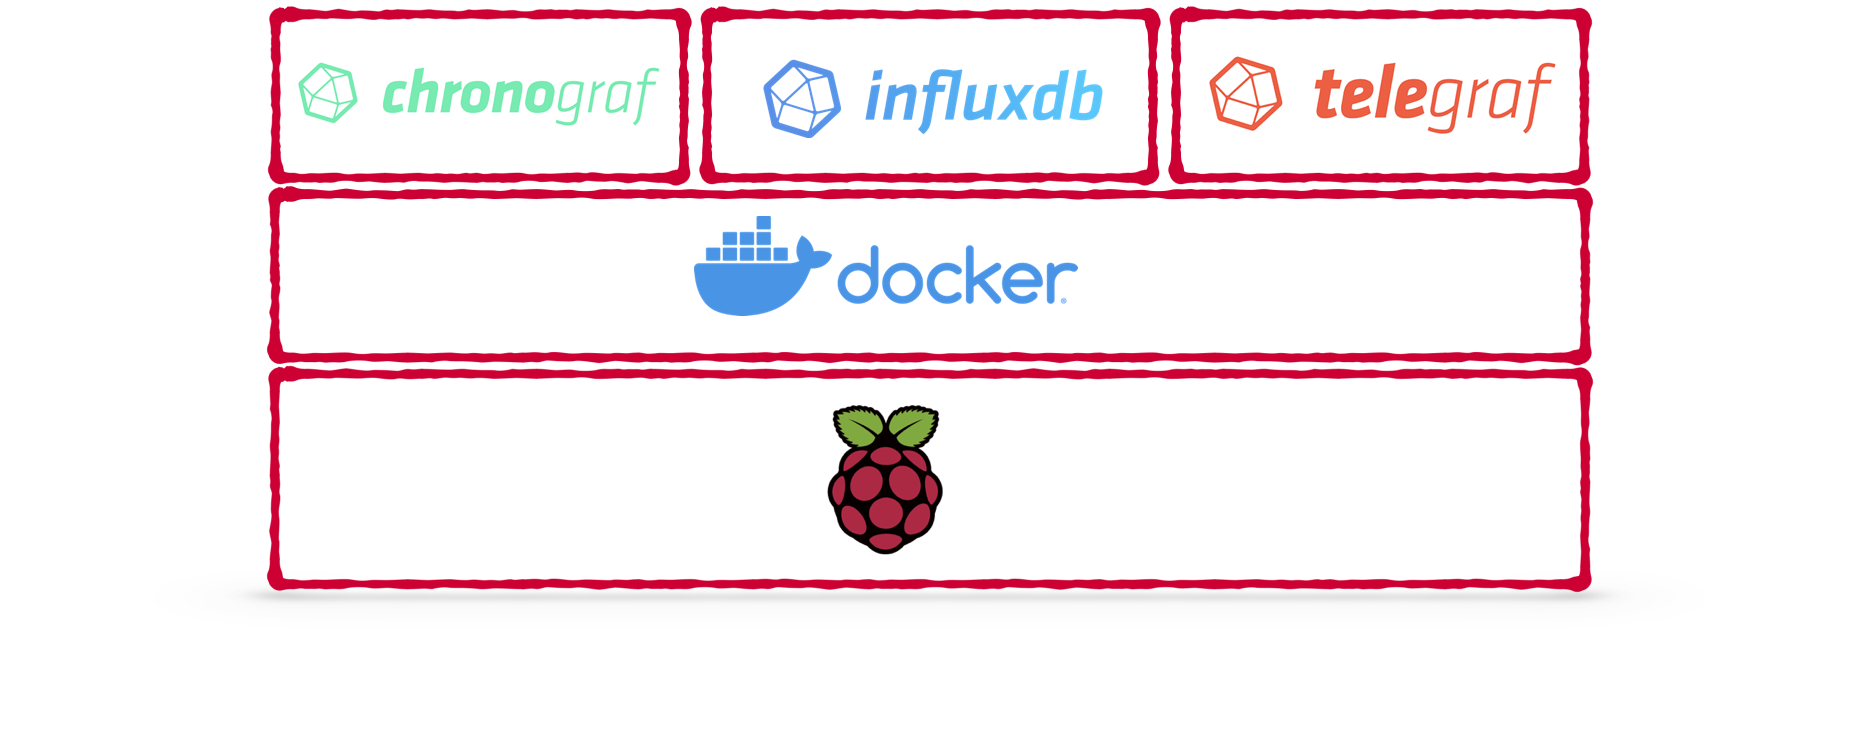
Running influxdb on Raspberry Pi using Docker compose
This blog post will explain how you can setup influxdb (and the telegraf plugin) on your Raspberry Pi using docker-compose. We will use the config-as-code to create a reproducible setup. This is extremely helpful for hobby projects that you come back to every now-and-then because you can lookup exactly what you are running 😉
Continue reading
How to setup Raspberry Pi as home server with Docker support
This blog post will cover how to setup a Raspberry Pi with Docker support. It will also cover some basic steps that will make it easier to work with your RasPi later on. This setup will work completely without monitor/keyboard for your Raspberry but you need a LAN connection to it. I wrote most commands so they are easily pastable and do not require too much interactive work - you should however carefully read what is going on with each of those commands before you fire them off!
Continue reading