
Setting up Grafana on Raspberry Pi with Docker (compose)
In previous blog posts I showed you how to setup a Raspberry Pi with docker-compose support and how to run InfluxDB on your Raspberry Pi. This tutorial will add Grafana to your Pi-stack and give you a complete monitoring setup. The InfluxDB+Grafana stack is heavily used in DevOps scenarios but also extremely useful if you want to visualize any kind of timeseries data at home; power consumption, smart home events, computer uptime, amount of devices in your network, weather in your basement … endless opportunities at your fingertips!
This post assumes that you already have a Raspberry Pi with docker-compose installed; if you do not you may want to read up on this blog post.
Prepare the folder structure
As with the InfluxDB setup, we first need to create some local folders to mount into the grafana docker container for persistence on the Raspberry disk.
$HOME/docker/
├── grafana/
│   ├── data/ # grafana working directory
│   ├── provisioning/ # placeholder for provisioning scripts that grafana will load on boot
│   └── grafana.ini # config for grafana instance
└── compose-files/
    └── grafana
        ├── .env # file containing user secrets
        └── docker-compose.yml # specification of docker containers to run
To create those folders you can use the following commands:
mkdir -p $HOME/docker/grafana/data
mkdir -p $HOME/docker/grafana/provisioning
mkdir -p $HOME/docker/compose-files/grafana
To get the correct configuration file for whatever grafana version you are running you can use the following command to spin-up a docker container and extract its default configuration:
cd $HOME/docker/grafana
docker run --rm --entrypoint /bin/bash grafana/grafana:latest -c 'cat $GF_PATHS_CONFIG' > grafana.ini
⚠️ Change
latestto whatever version you plan to run. In this tutorial we will uselatest.
For Grafana to be able to write to the data mount it needs to own the grafana/data directory.
There are two ways to achieve this:
- Make sure your local directory is owned by the default Grafana user ID 472:472
chown 472:472 $HOME/docker/grafana/data
- Run the Grafana container with your local user ID that already owns the directory
- find your user id with
id -uand put it in thedocker-compose.ymllater
Personally, I prefer option 1 on the Raspberry Pi, but found out it does not work that well on MacOS where you might want to run this setup as well.
Creating the .env file
To make sure you do not have to expose credentials in your docker-compose.yml file I recommend to create a separate .env file next to the compose file.
This will automatically be sourced by the docker-compose script and the variables will be available in the compose file later on.
# $HOME/docker/compose-files/grafana/.env
GF_SECURITY_ADMIN_USER=admin
GF_SECURITY_ADMIN_PASSWORD=initialpassword
docker-compose.yml
With the directories setup you can create the $HOME/docker/compose-files/grafana/docker-compose.yml file.
The entire file looks like this:
version: "3.3"

services:
  grafana:
    image: grafana/grafana:latest
    container_name: grafana
    restart: always
    # user: "1000" # needs to be `id -u` // alternatively chown the grafana/data dir to 472:472
    ports:
      - "3000:3000" # expose for localhost
    volumes:
      - $HOME/docker/grafana/data:/var/lib/grafana # data path
      - $HOME/docker/grafana/grafana.ini:/etc/grafana/grafana.ini
      - $HOME/docker/grafana/provisioning:/etc/grafana/provisioning
    environment:
      - GF_INSTALL_PLUGINS=grafana-clock-panel,grafana-simple-json-datasource
      - GF_SECURITY_ADMIN_USER=${GF_SECURITY_ADMIN_USER}
      - GF_SECURITY_ADMIN_PASSWORD=${GF_SECURITY_ADMIN_PASSWORD}
Let us dissect this a bit.
image and container_name should be clear.
restart: always ensures that the container will be started automatically after rebooting the host system (Raspberry Pi).
In the volumes, define the mountpoints previously created.
ports tells Docker to forward the Grafana default port to the Raspberry Pi host, so it will be reachable from within your network.
🚨 If anything goes wrong, double-check that the Grafana docker user owns the
/var/lib/grafanamountpoint.
One important environment variable that you want to remember is GF_INSTALL_PLUGINS that allows you to bootstrap your grafana docker image with pre-installed plugins.
In addition we define pass the GF_SECURITY_ADMIN_USER/PASSWORD credentials from our .env file into the container.
Start Grafana
With all configuration done you can start the Grafana container:
cd $HOME/docker/compose-files/grafana
docker-compose up -d
To check if everything is running fine you can run docker ps and look for a container named grafana.
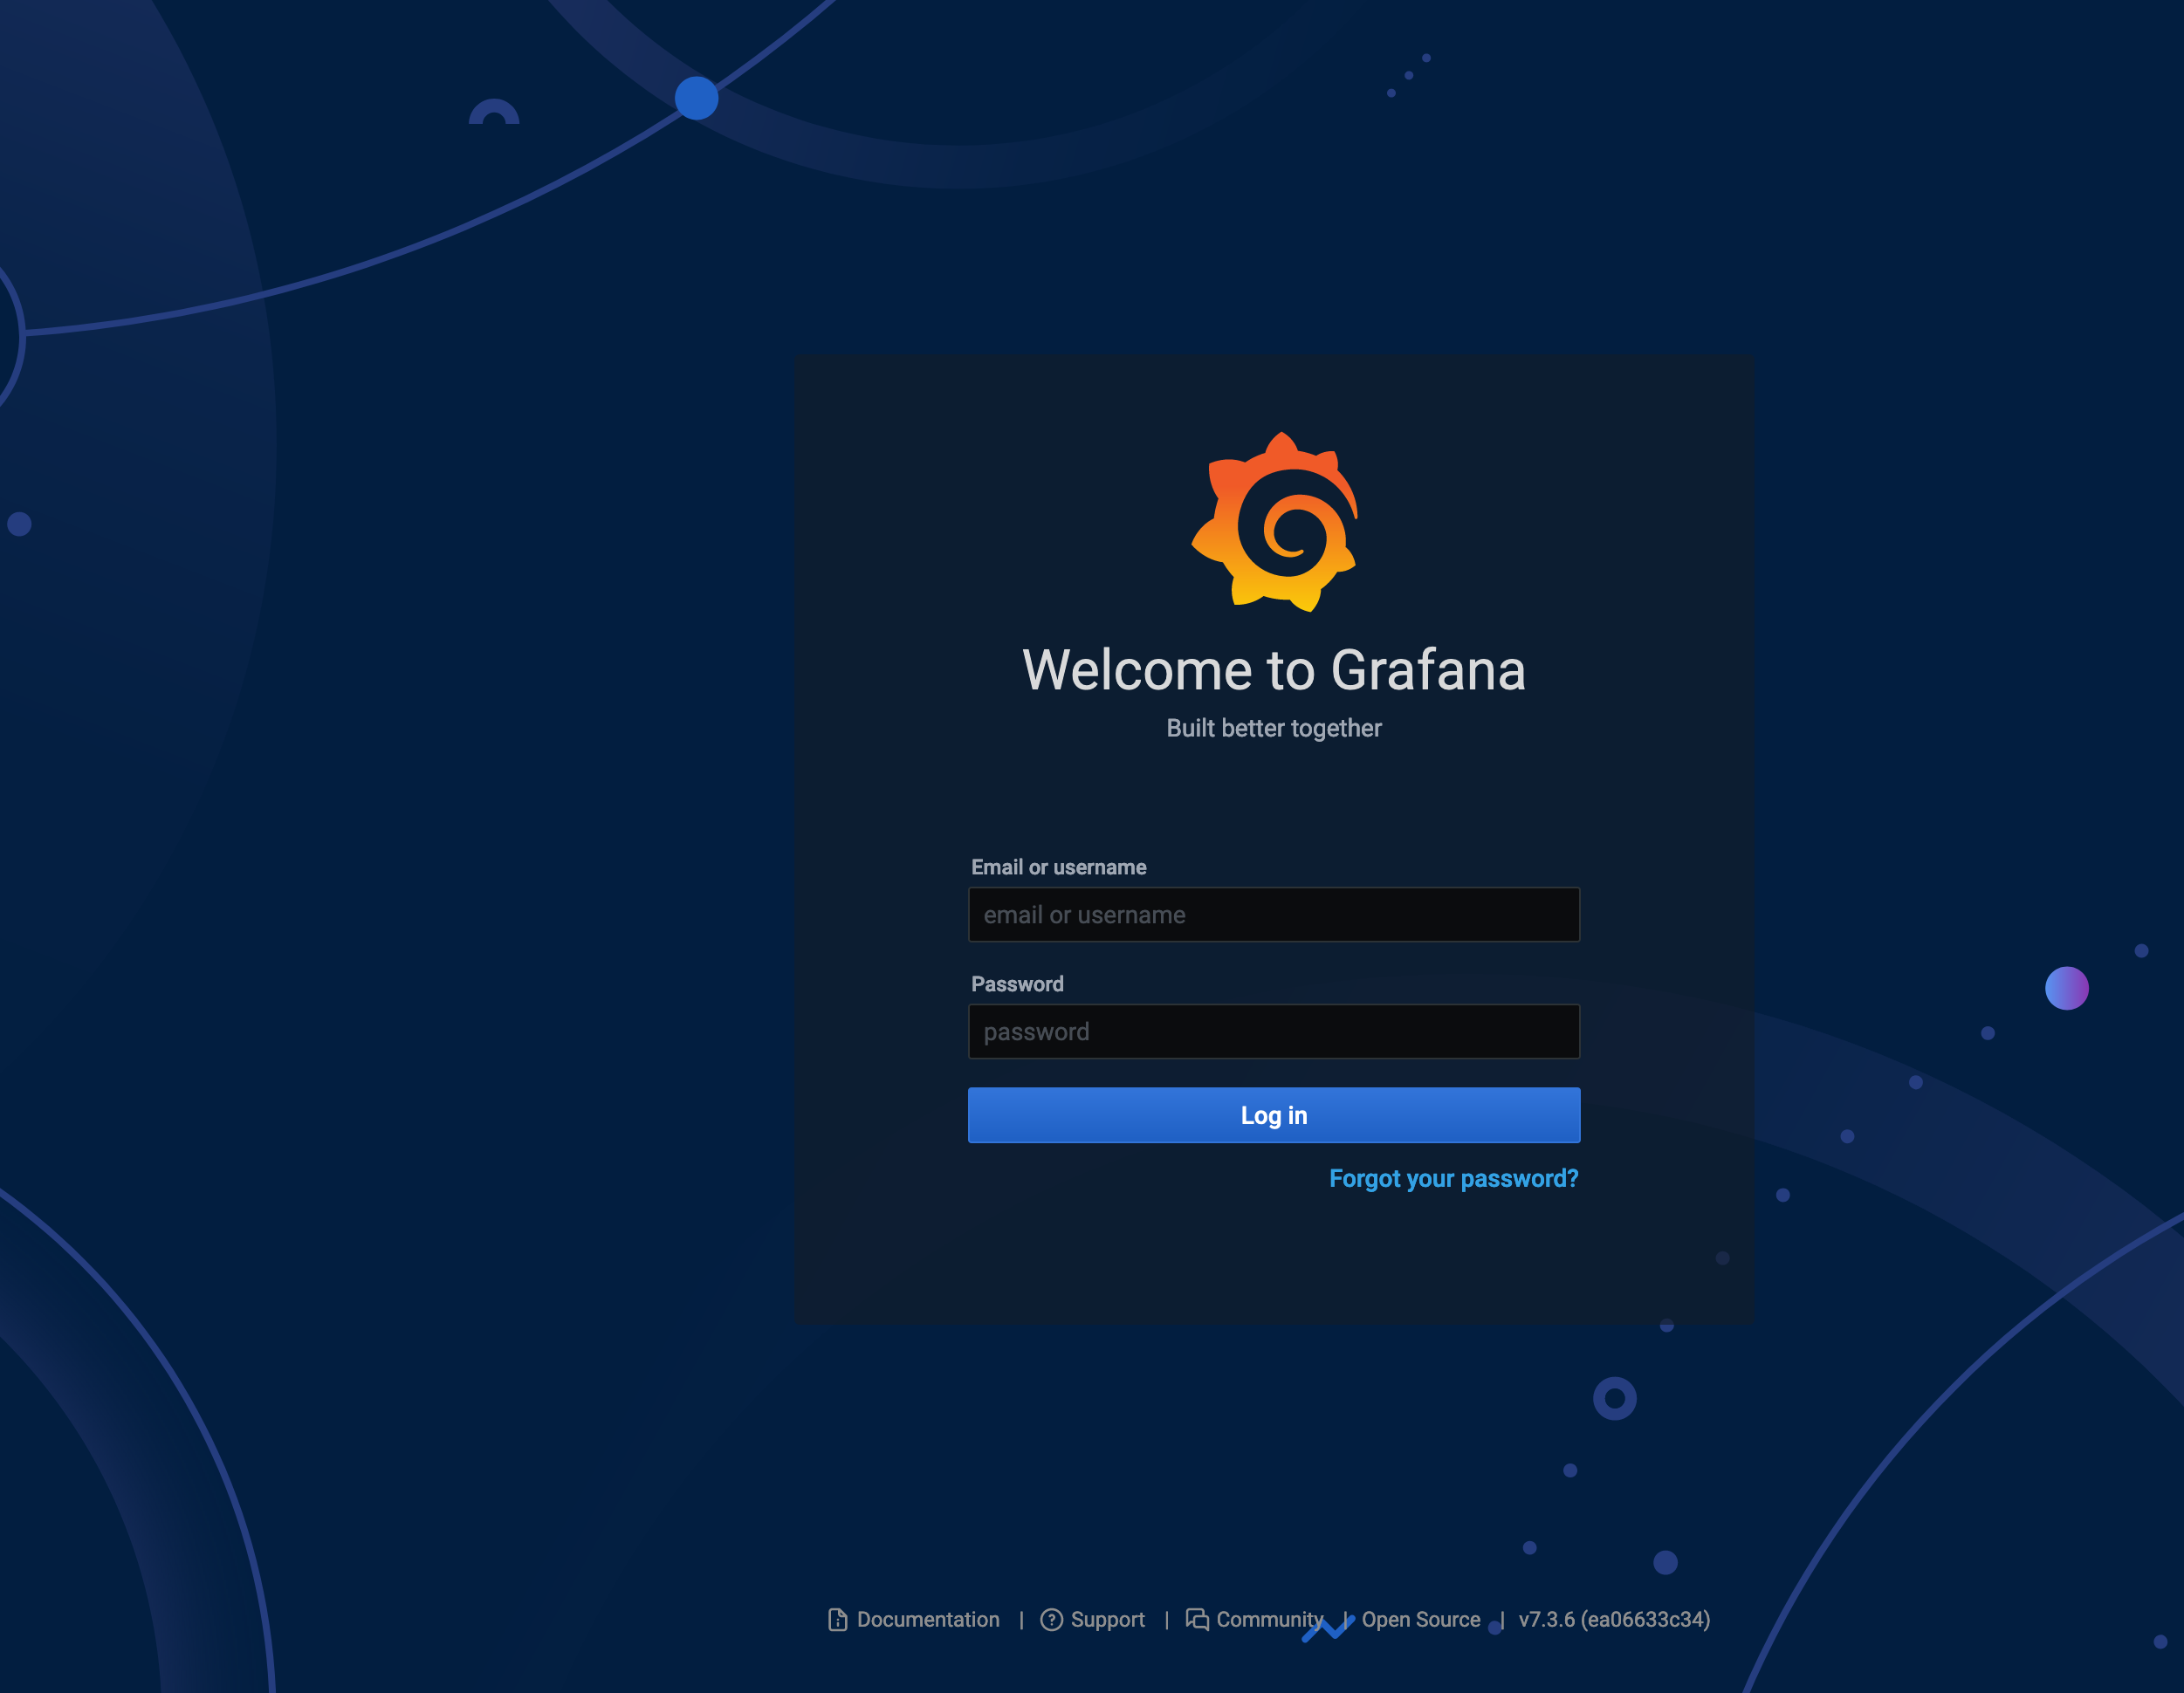
You should now be able to access your Grafana instance via a browser by opening http://raspberrypi:3000 (or whatever the hostname of your raspi is 😉) and see the login screen.
If any of this is outdated or does not work for you please leave a comment or reach out via Twitter. Appreciate the feedback 👋